
2025: What the Numbers Really Tell Us
(Broken Down into 9 Parts)
JIMMY MARTINELLO PHOTO - Julia and Davey Summiting Mt Matier
At the beginning of evert year, the stats are revealed.
Most people look at one number — total sales — and draw conclusions.
We prefer context.
We’ve reviewed the full 2025 Whistler Year-End Stats Package in detail.
Below is what the data actually shows — and what it means for buyers and sellers right now.
Follow along with this download:
Whistler 2025 Stats PDF
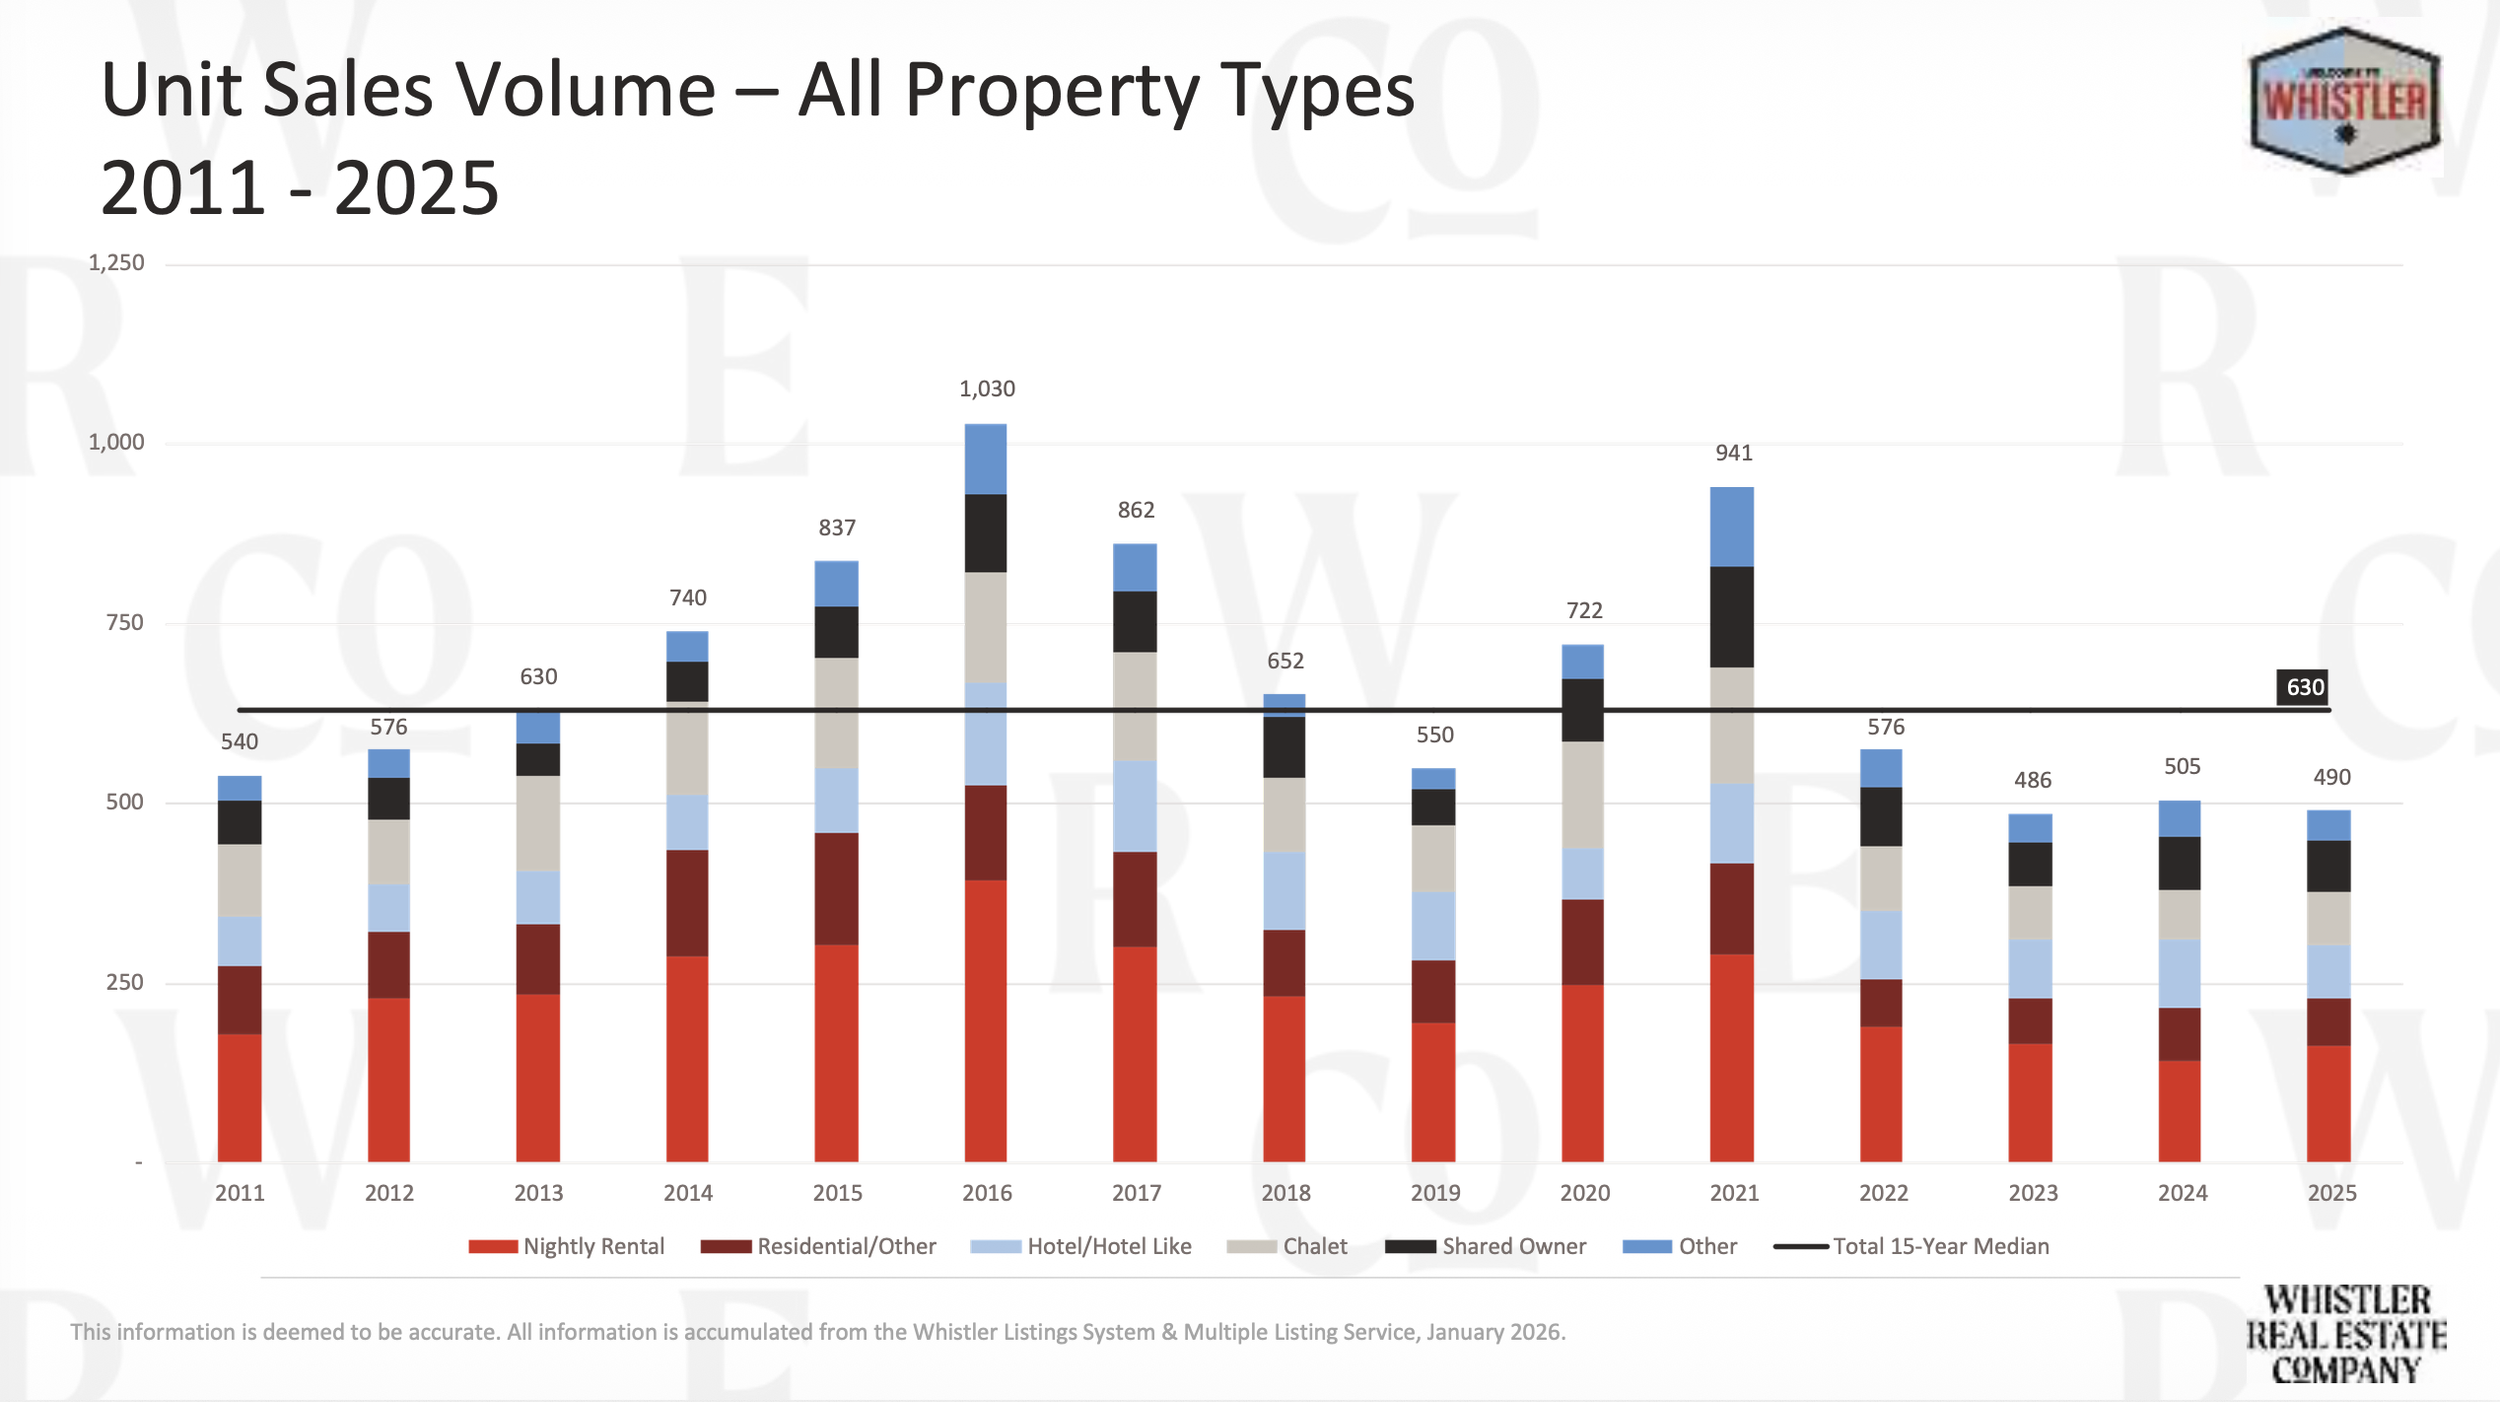
1. Total Market Activity:
Back to Historical Norms
Total unit sales in 2025: 490
(See Unit Sales Breakdown – page 36)
For perspective:
• 2021: 941 sales
• 2022: 576 sales
• 2023: 486 sales
• 2024: 505 sales
• 2025: 490 sales
The pandemic spike was the outlier.
2025 reflects normalization — not decline.
From a strategic standpoint, this is healthier. Negotiations are rational. Pricing matters again.
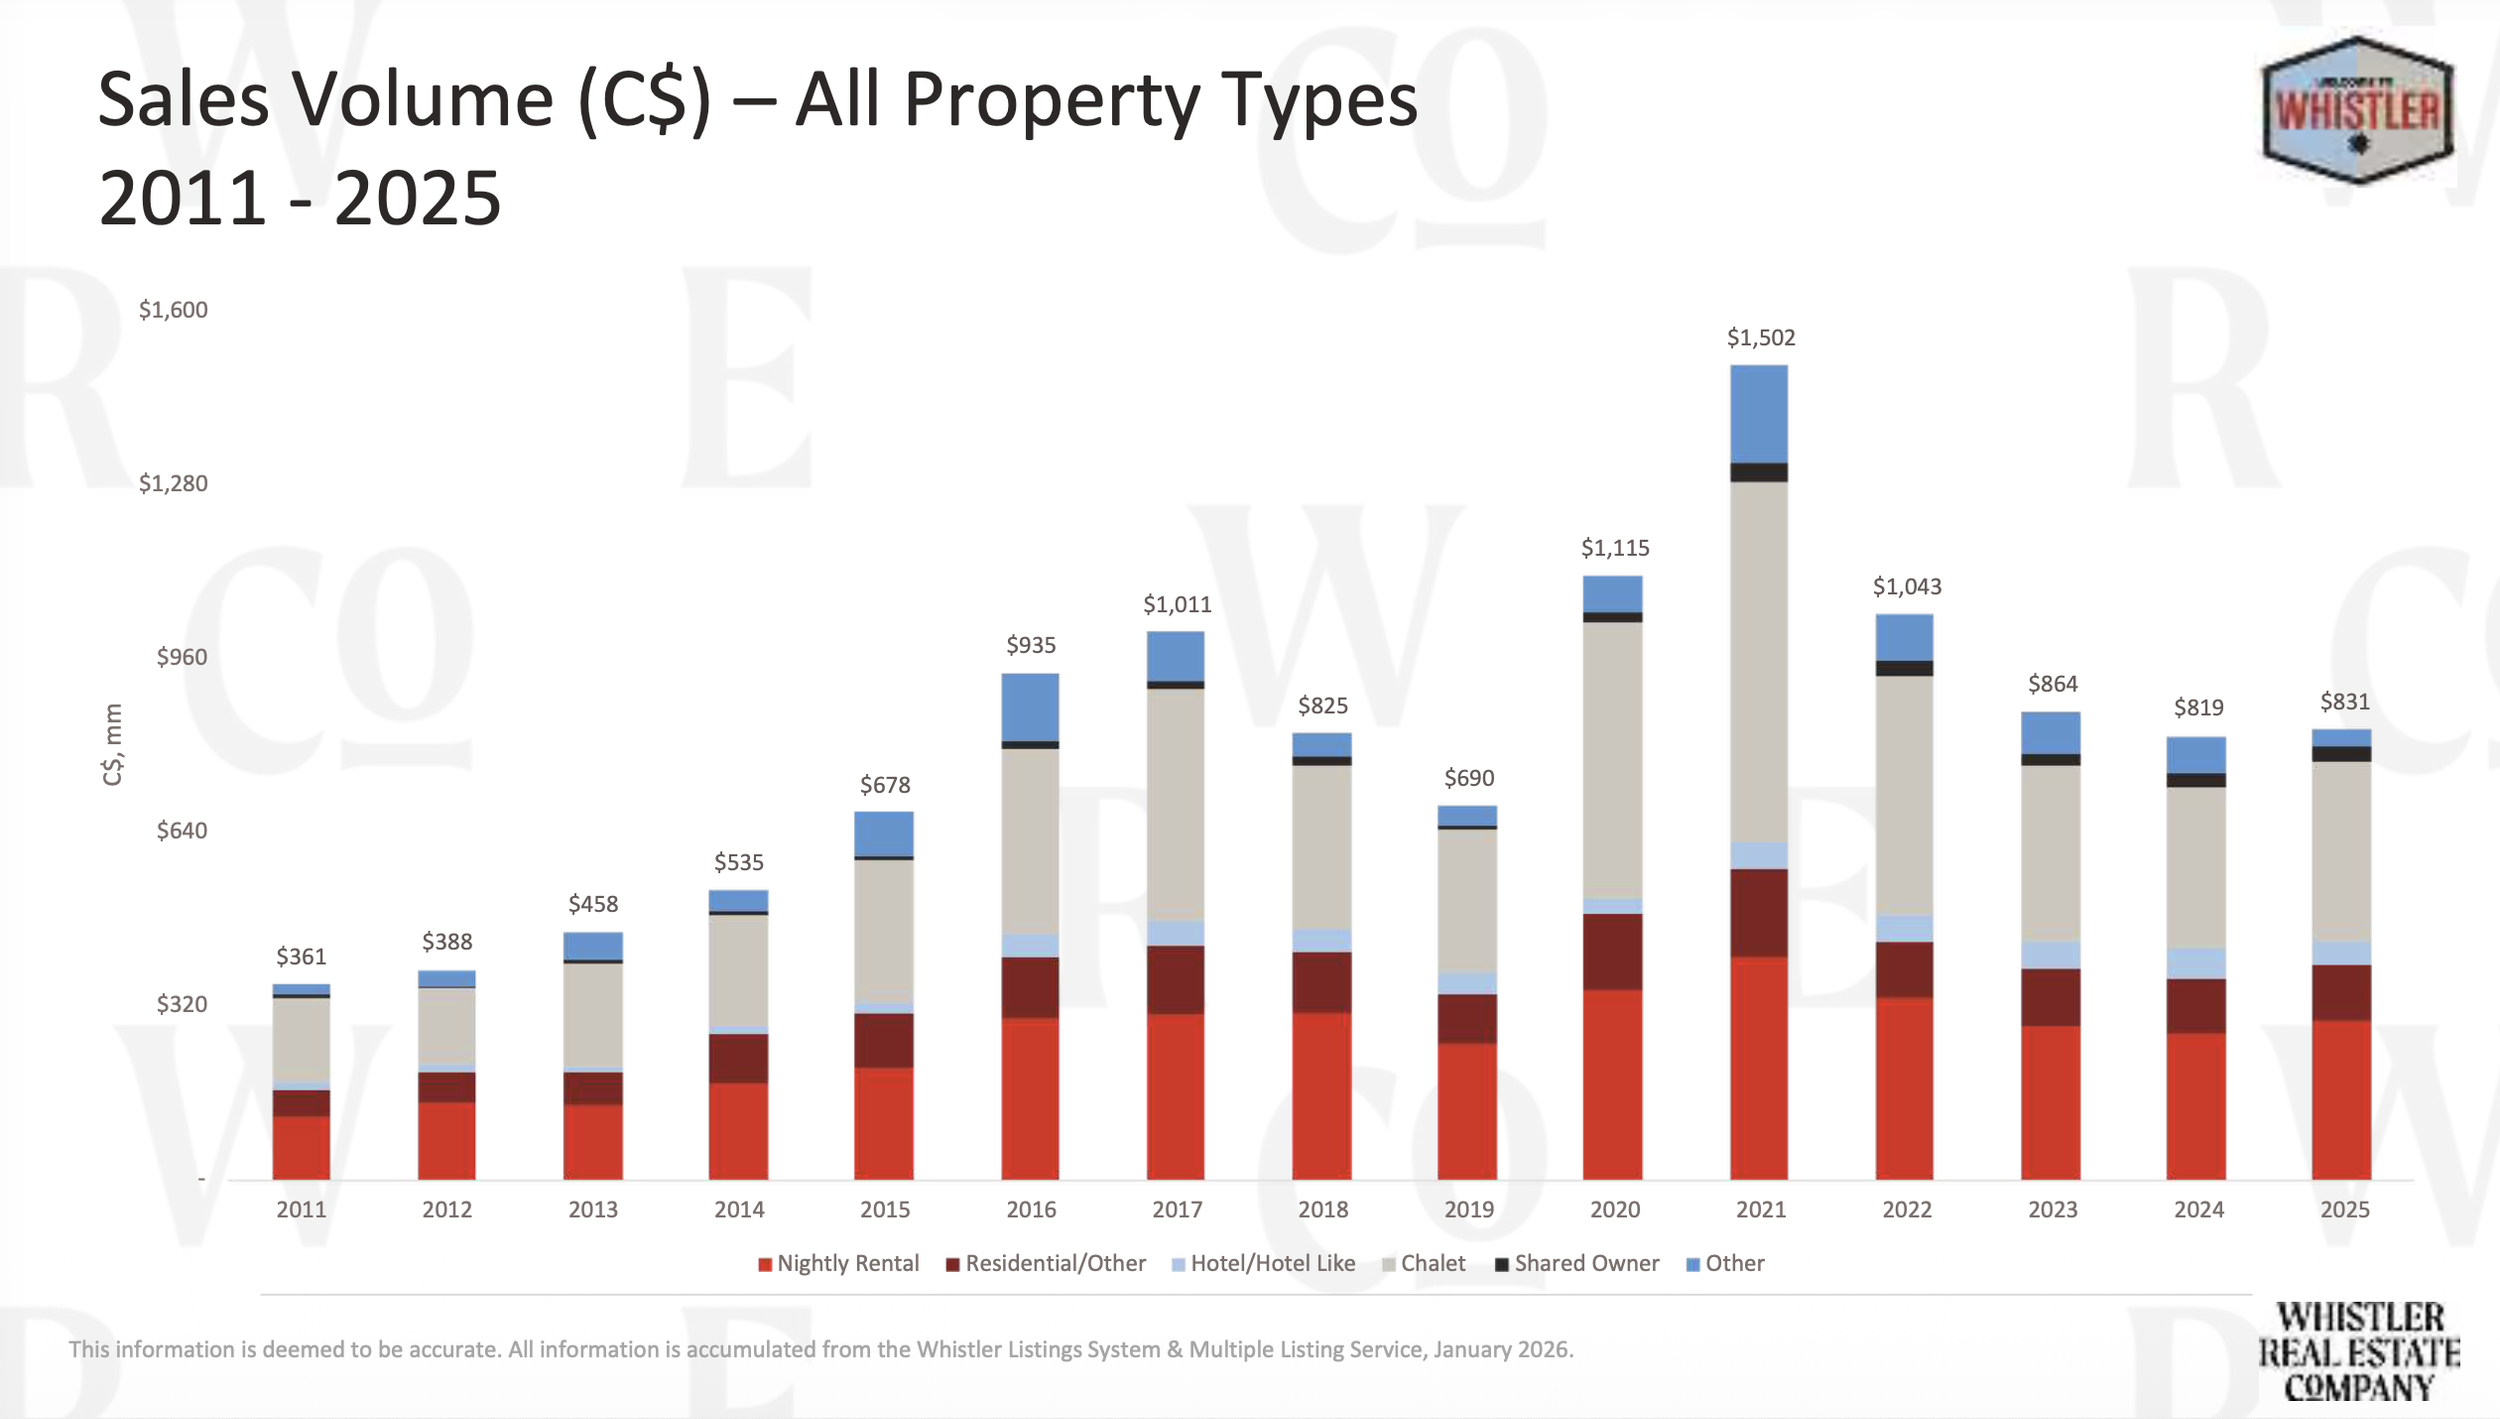
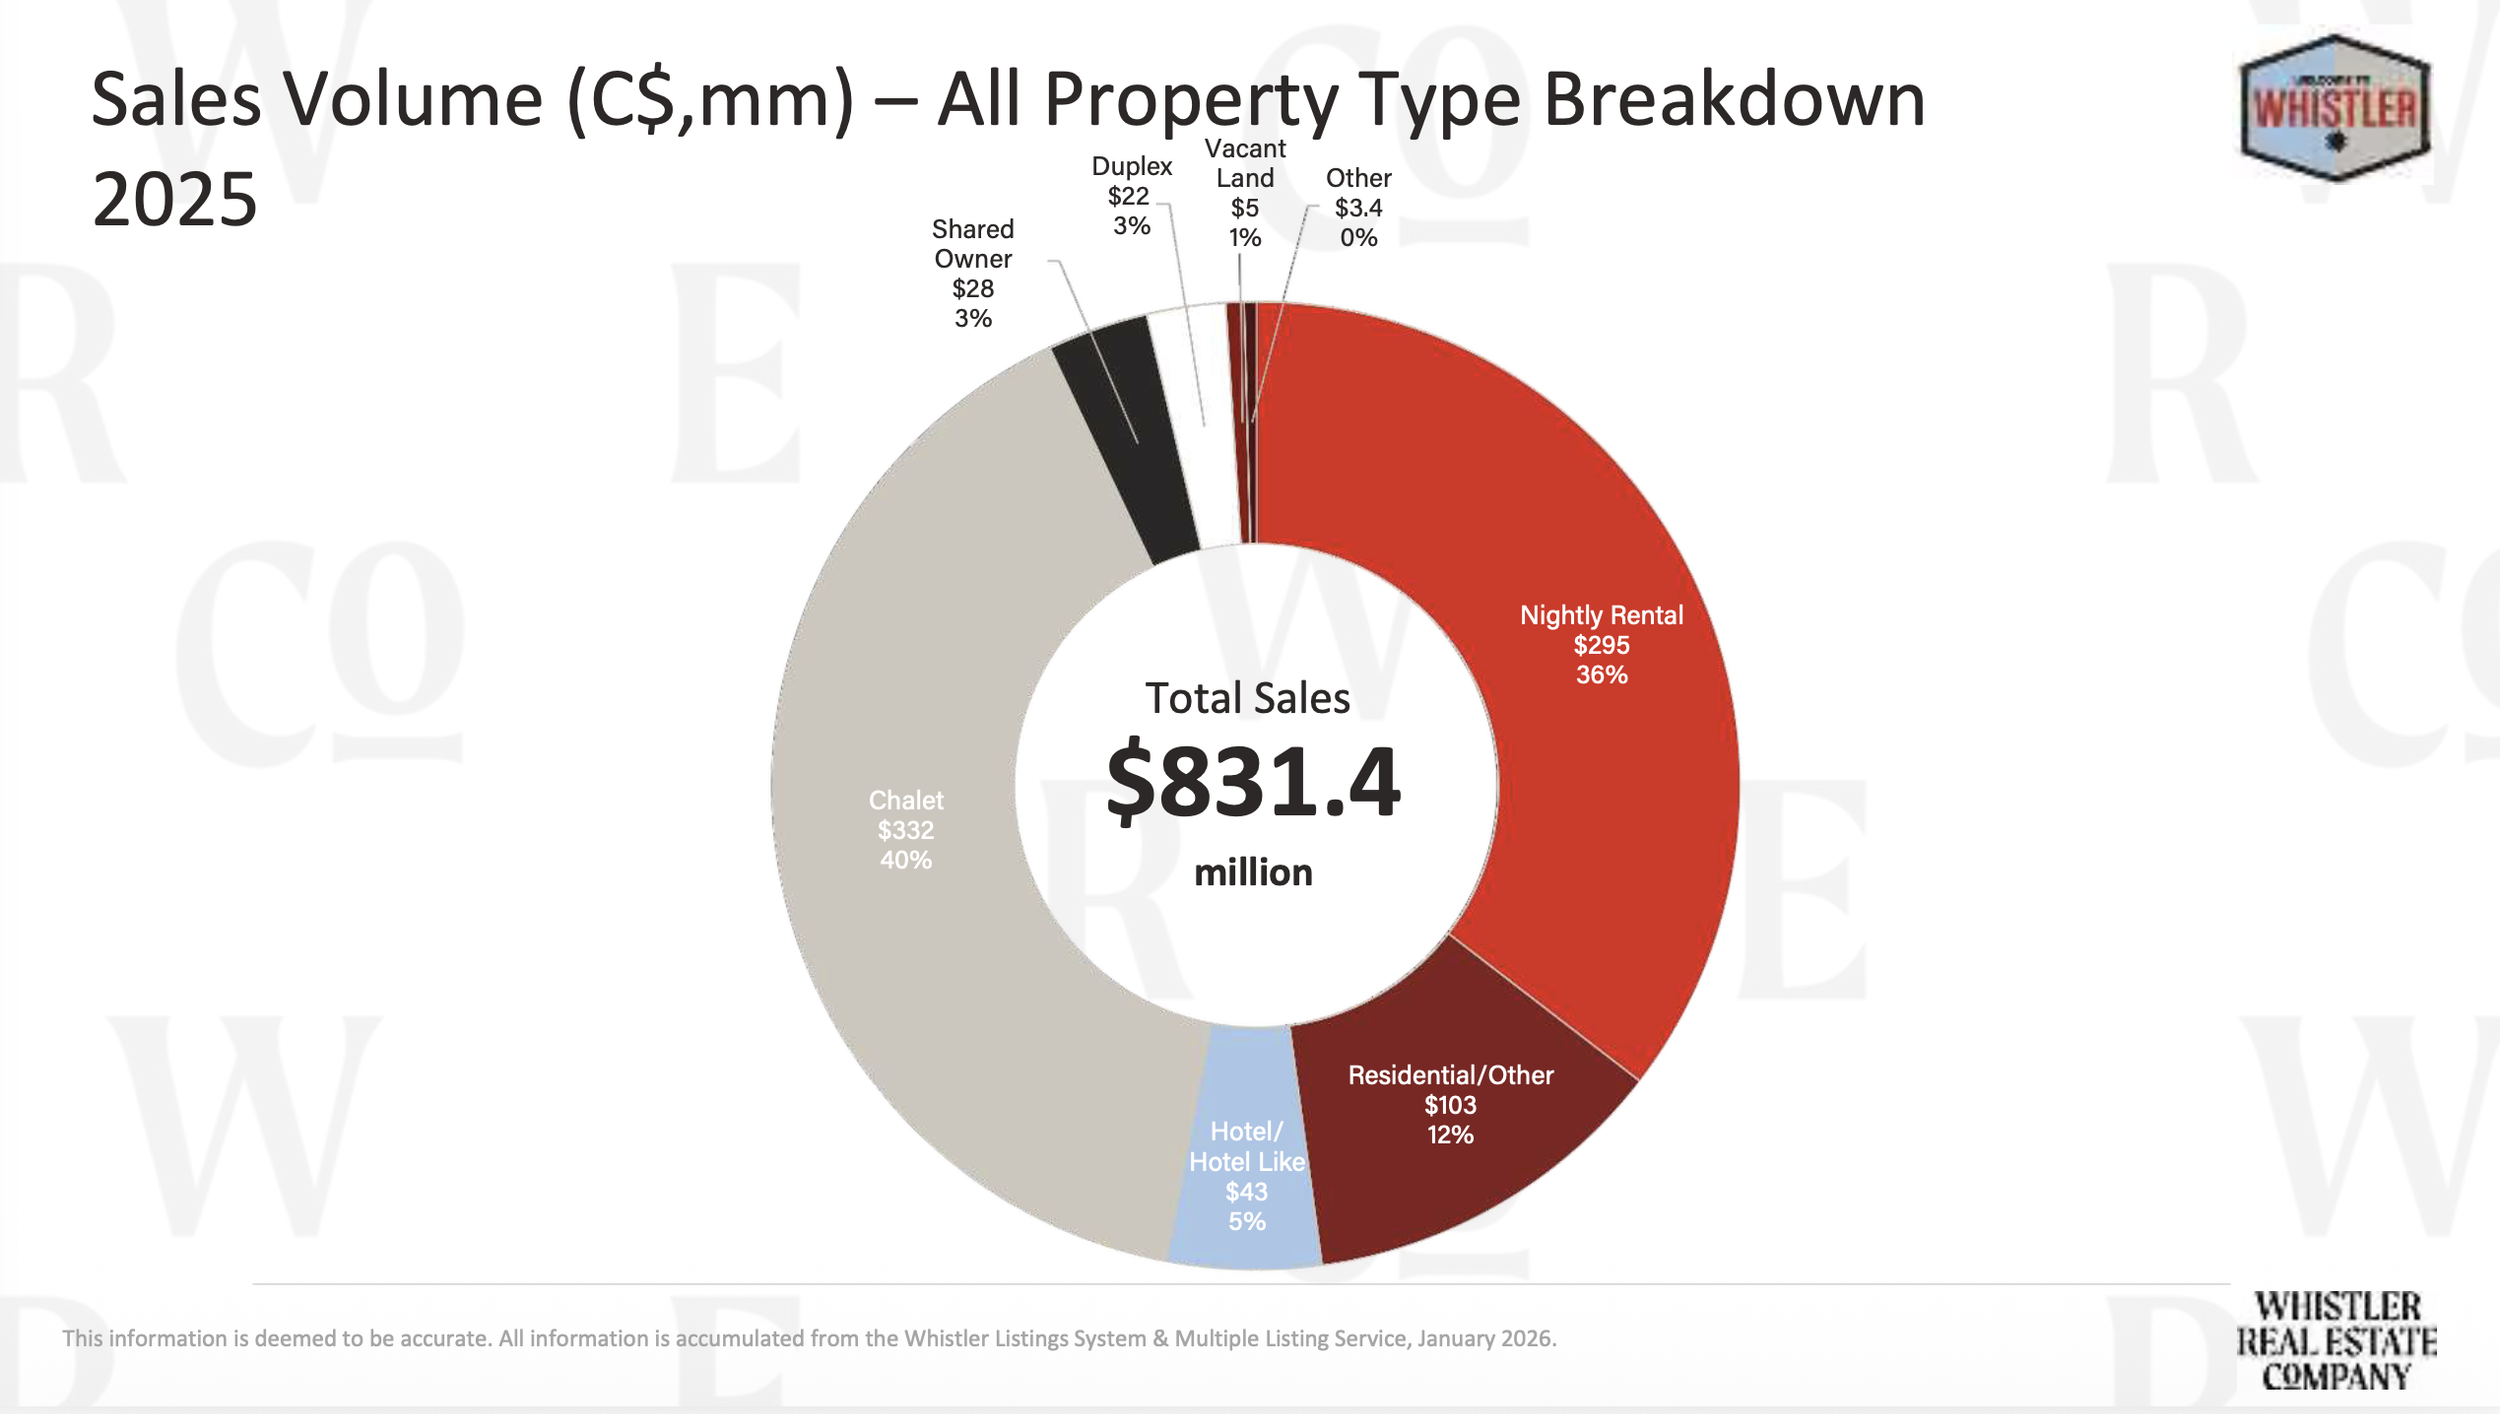
2. Dollar Volume: Still a Significant Market
Total dollar volume in 2025: $831.4 million
(See Sales Volume Breakdown – page 37)
Even with fewer transactions than peak years, Whistler remains a high-value, capital-intensive market.
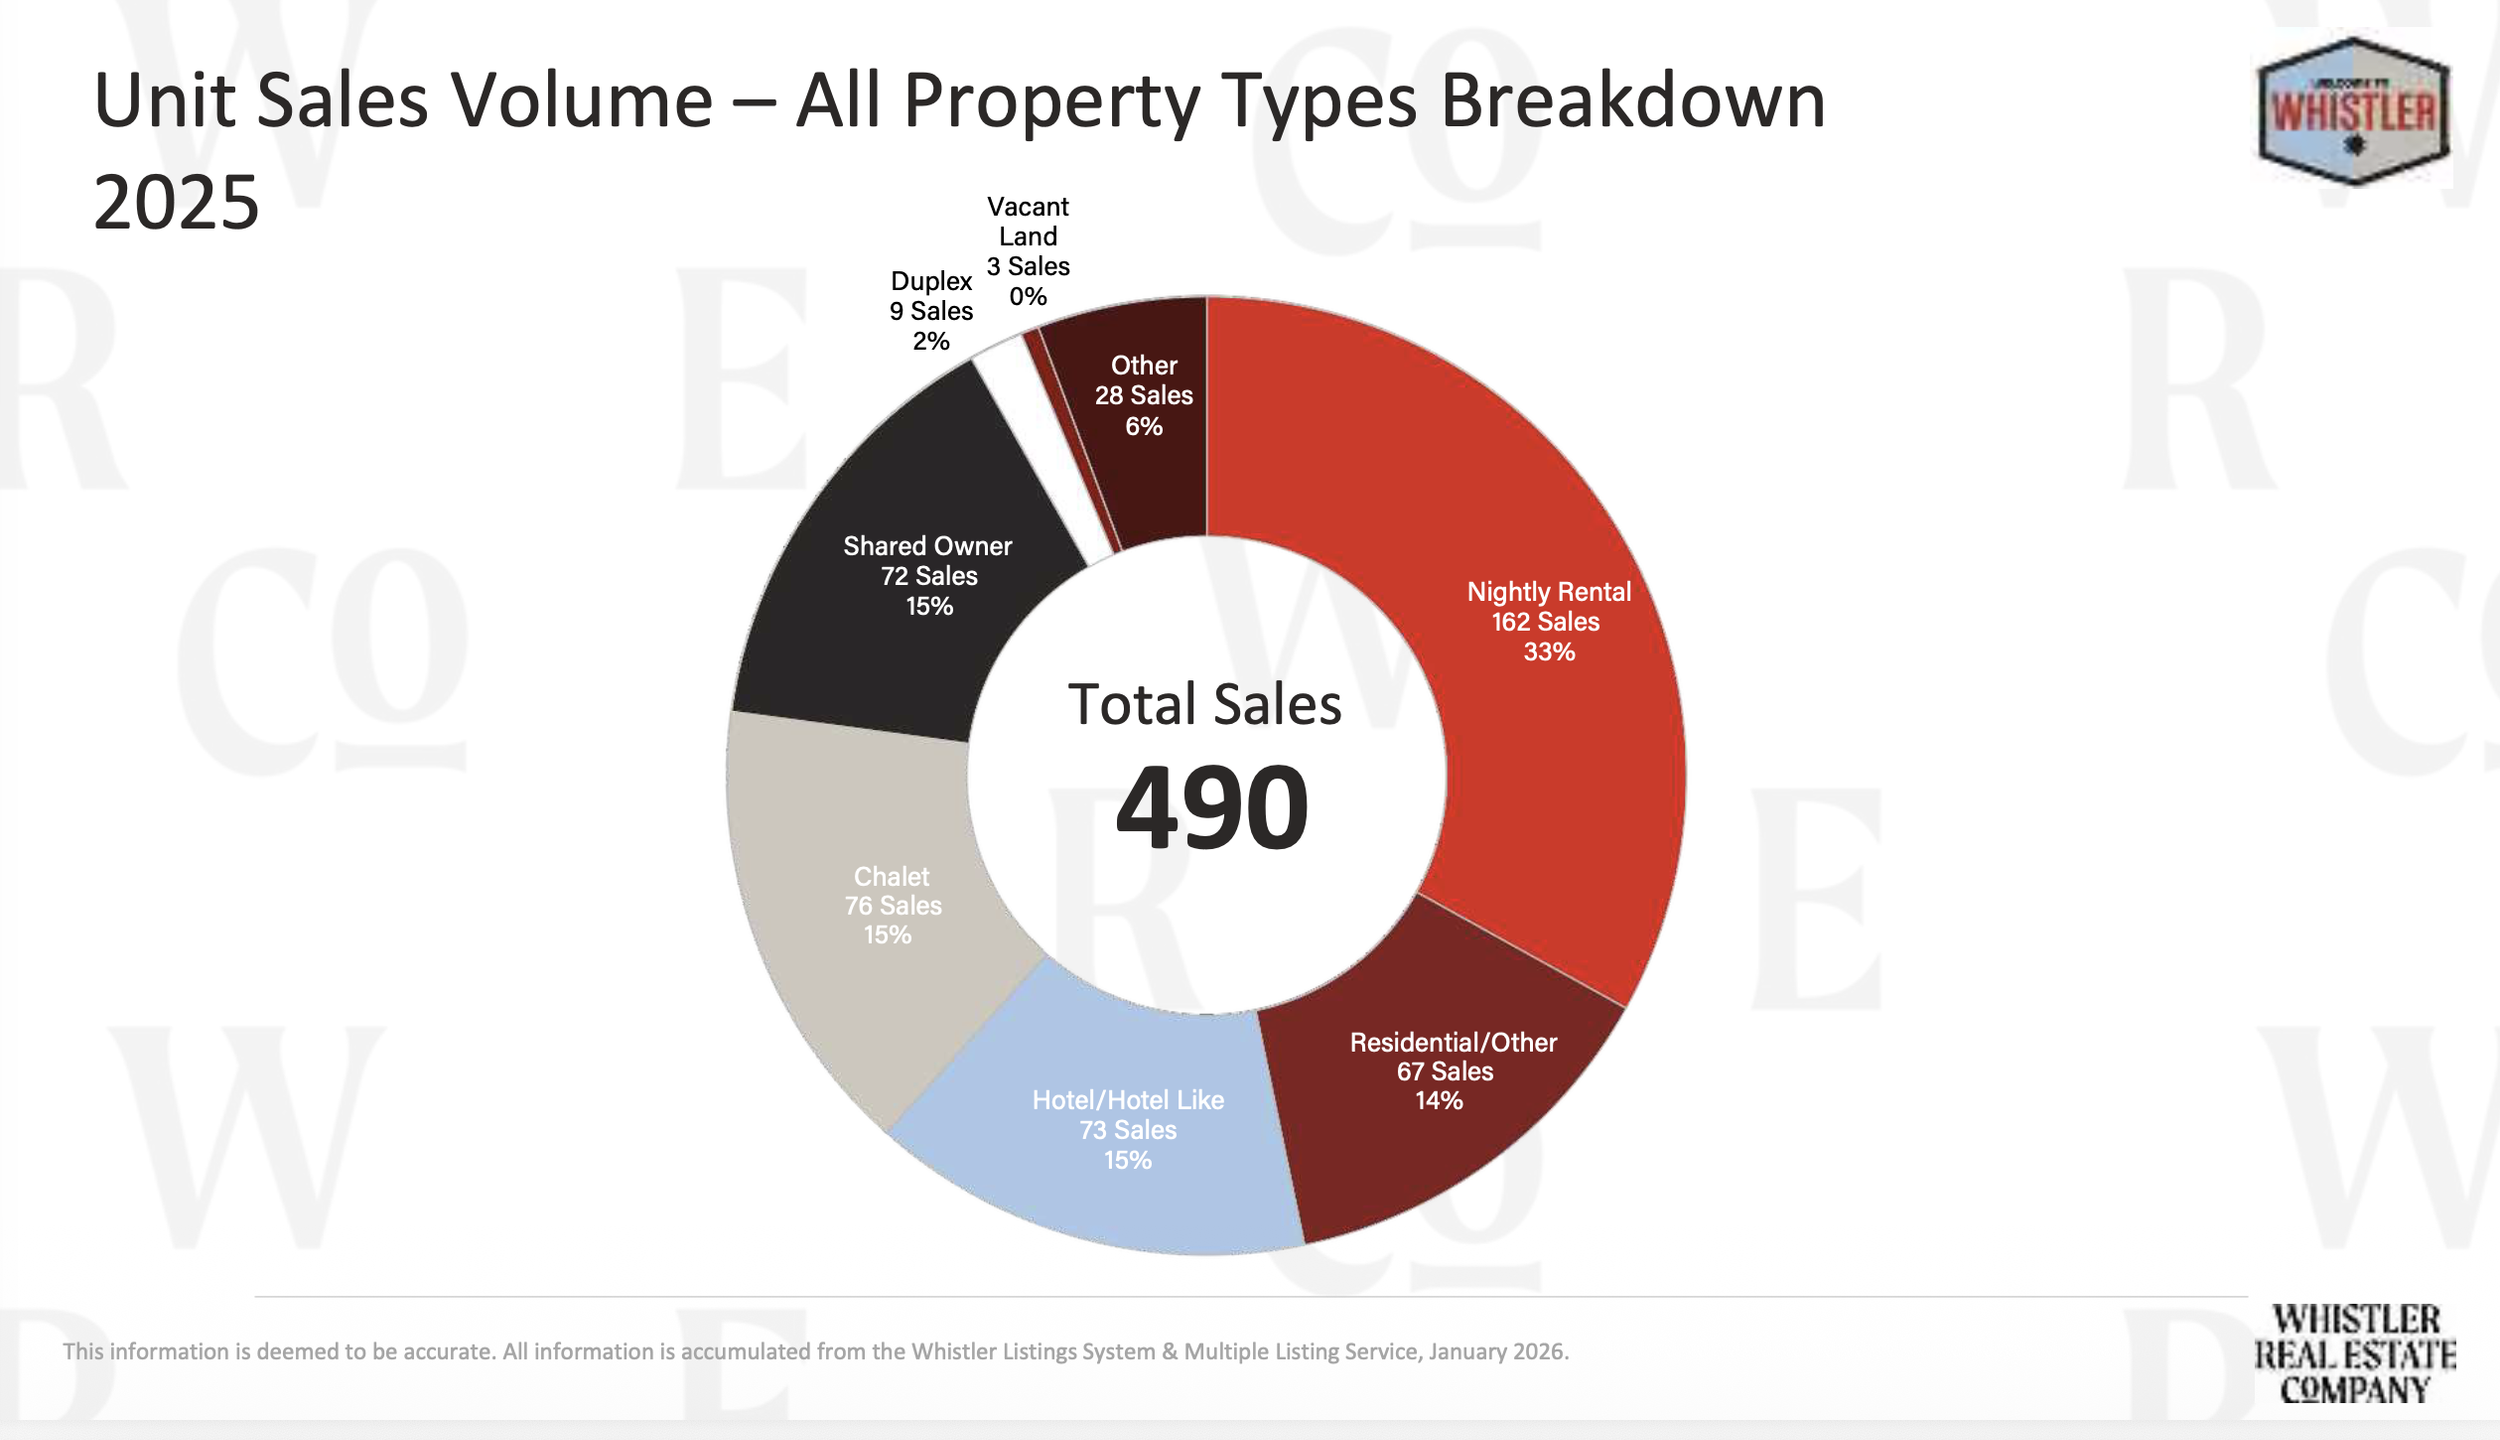
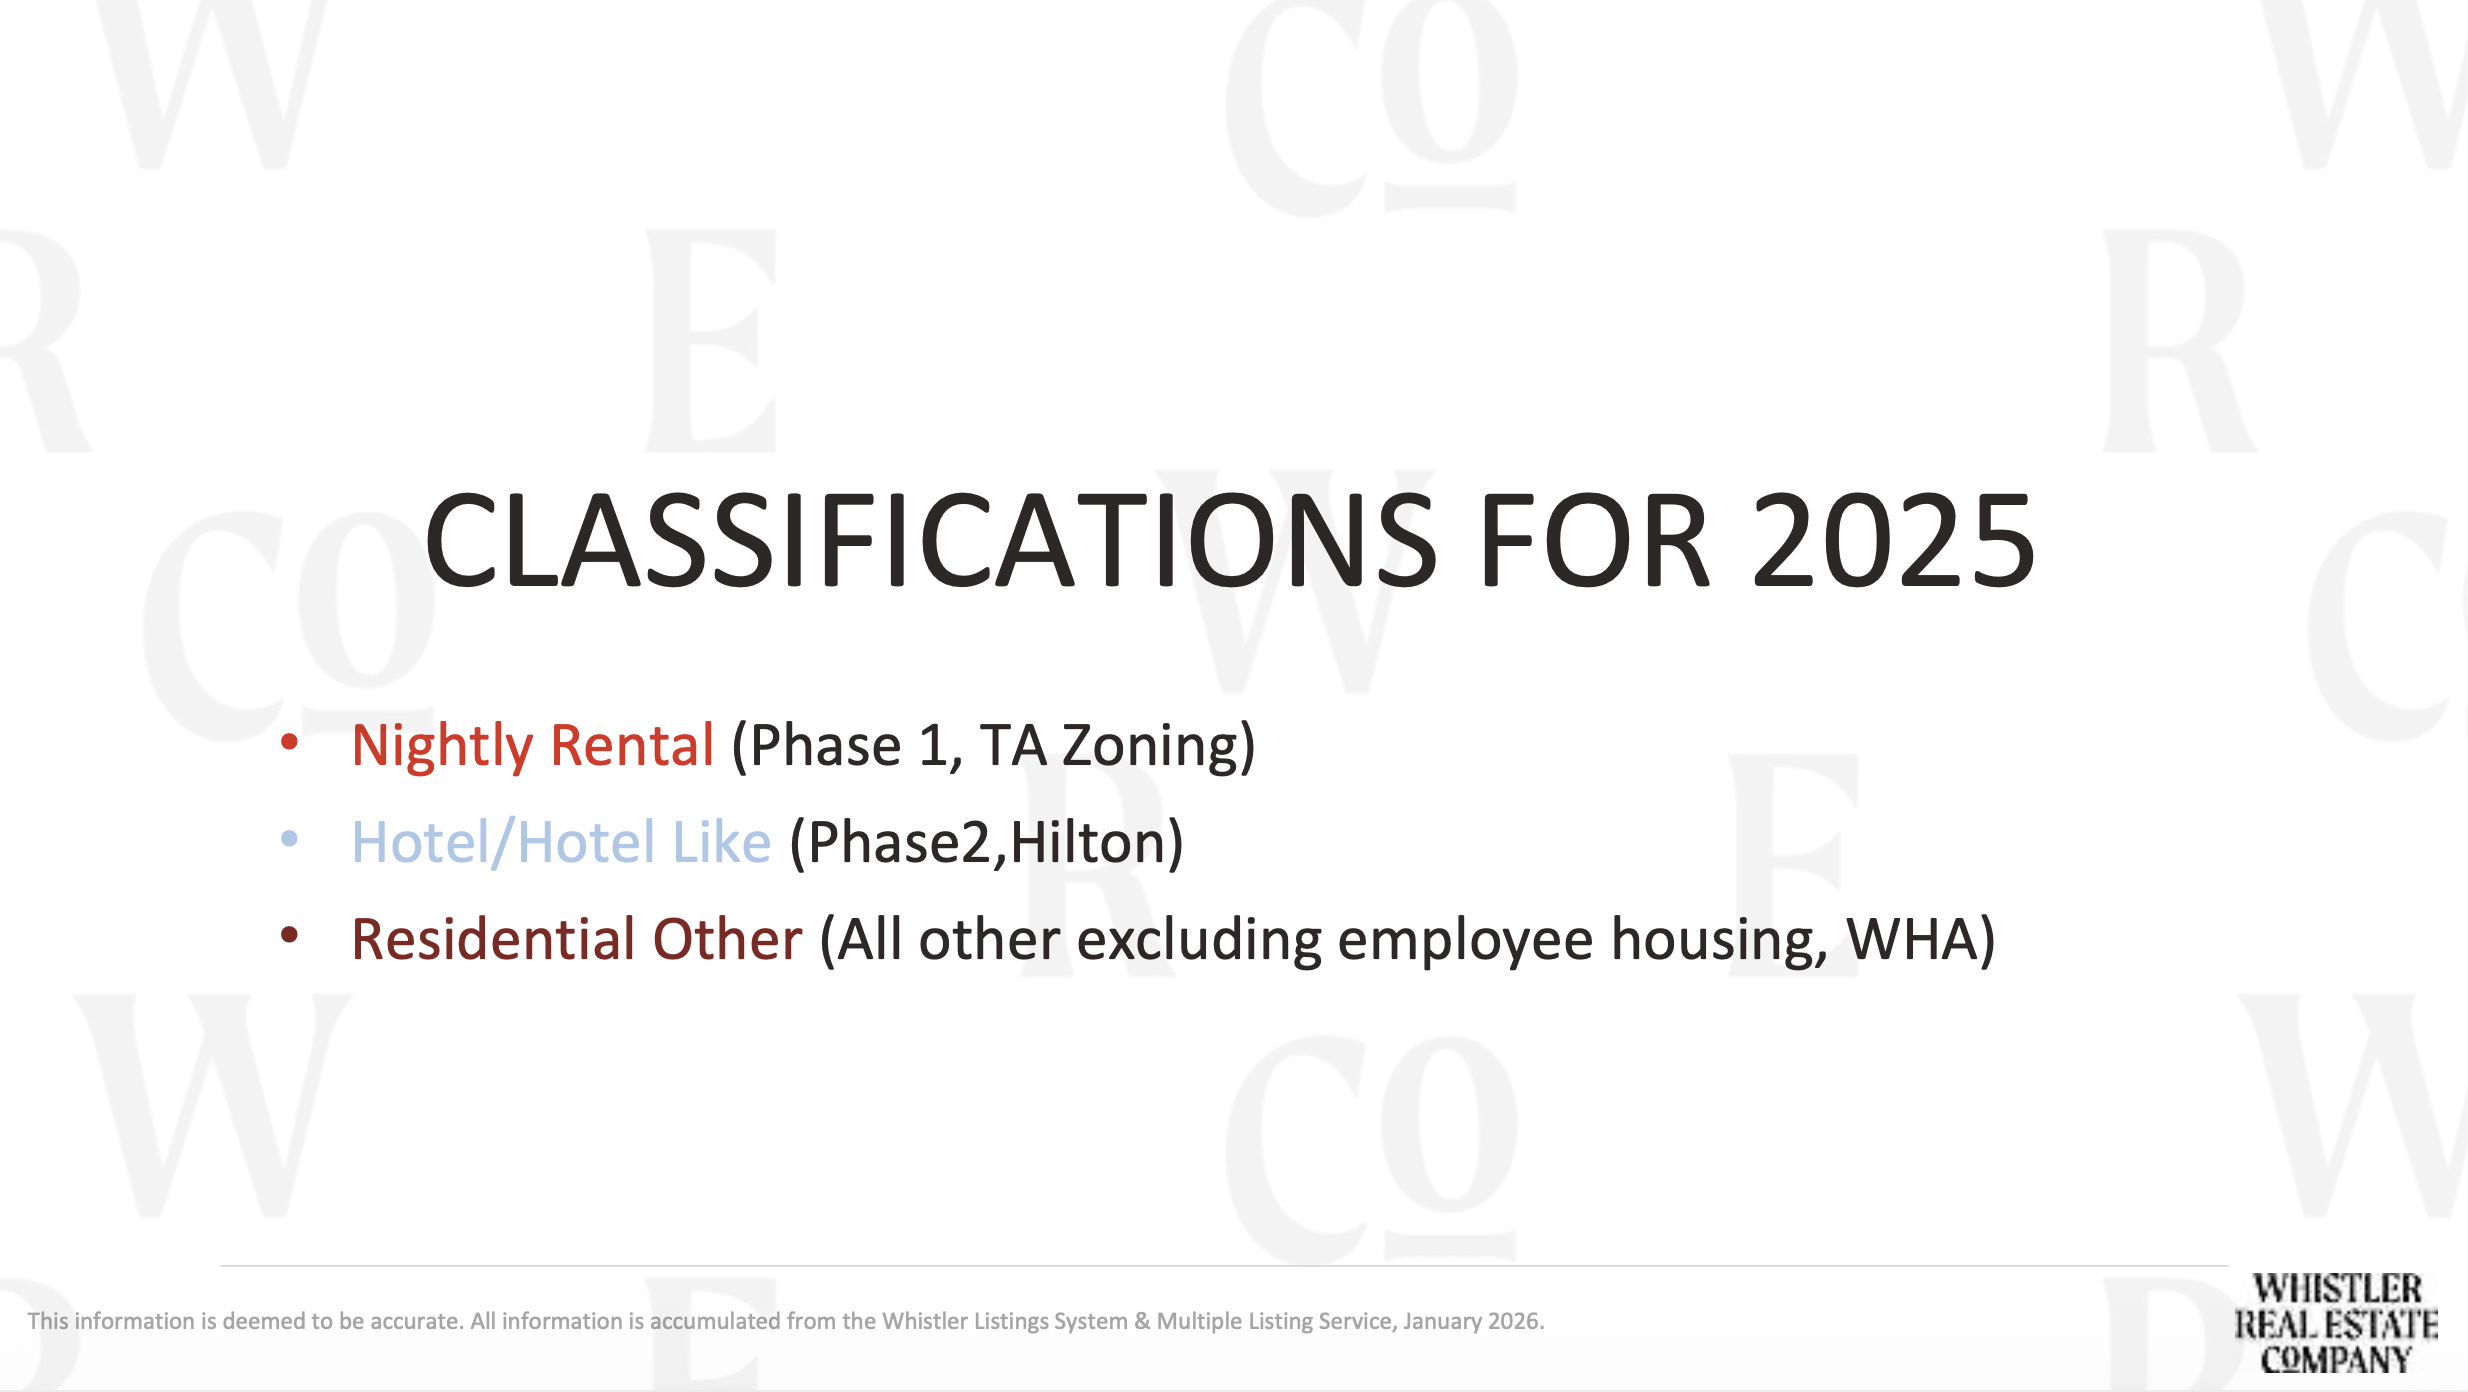
3. Phase 1 Properties Remains the Largest Segment
2025 Nightly Rental stats:
• 162 sales
• 33% of total unit sales
• $295M in dollar volume
• 36% of total dollar volume
(See pages 36–37)
The 5-year median for Nightly Rental unit sales sits at 164 (see page 6).
2025 landed at 162 — almost exactly on trend.
This segment continues to drive liquidity because it offers:
• Unlimited personal use
• Nightly rental flexibility
• Strong resale demand
Optionality continues to command value.
For more clarity on Zoning in Whistler (nightly rental options vs residential), head here.
4. Phase 2 / Hotel-Like: Income-Driven and Stable
2025 Hotel/Hotel-Like stats:
• 73 sales
• $43M in dollar volume
• 15% of total unit sales
(See pages 36–37)
The 5-year median for Hotel/Hotel-Like unit sales is 94 (page 8).
2025 came in below that — which reflects tighter buyer underwriting and income sensitivity.
This category behaves more like a financial asset than a lifestyle asset.
Buyers are evaluating yield and performance.
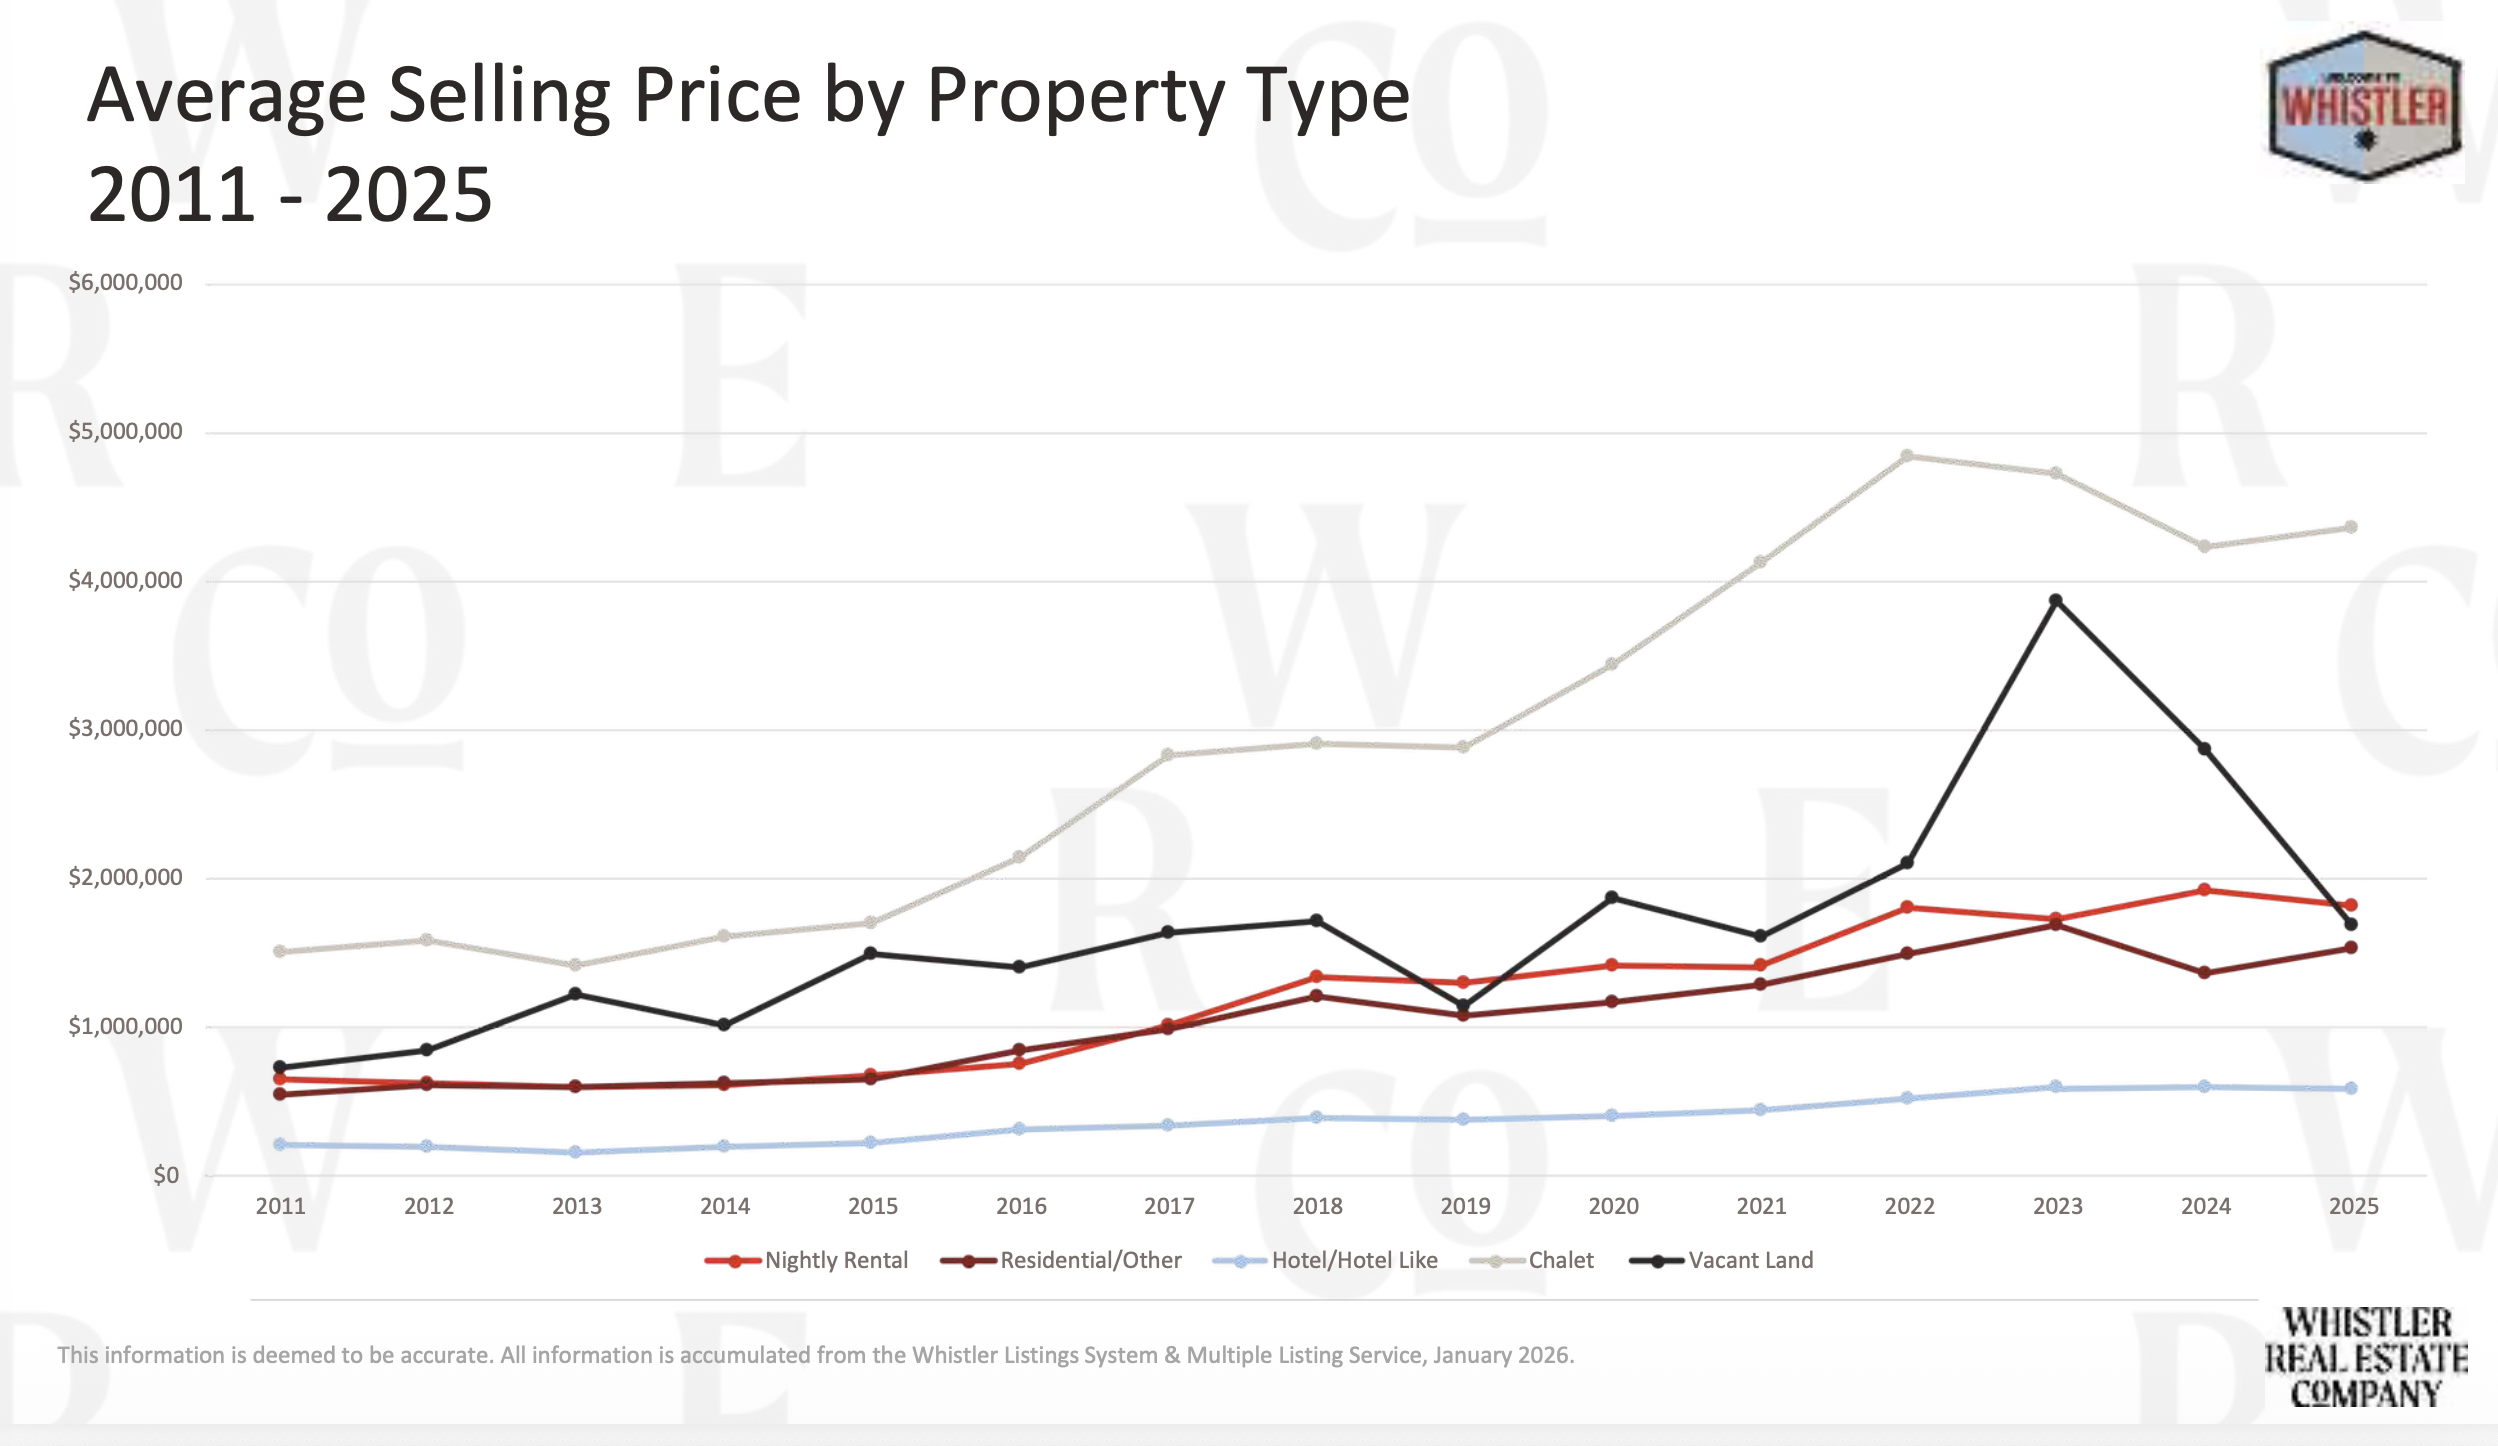
5. Chalet Market:
2025 Chalet stats:
• 76 sales
• $332M in dollar volume
• 40% of total dollar volume
(See page 37)
The 5-year median for Chalet unit sales is 78 (page 12).
2025 came in at 76 — very close to trend.
Sales over $3M continue to transact although less steadily (see Chalet Unit Sales by Price Point – page 41).
6. Residentially zoned market segement
2025 stats:
• 67 sales
• $103M in dollar volume
• 14% of unit sales
(See pages 36–37)
The 5-year median for this category is 68 (page 10).
2025 came in at 67 — again, essentially on trend.
7. Shared Ownership Market Segment
2025 stats:
• 72 sales
• $28M in dollar volume
• 15% of unit sales
(See pages 36–37)
The 5-year median is 72 (page 14).
2025 matched it exactly.
This segment remains active and consistent.
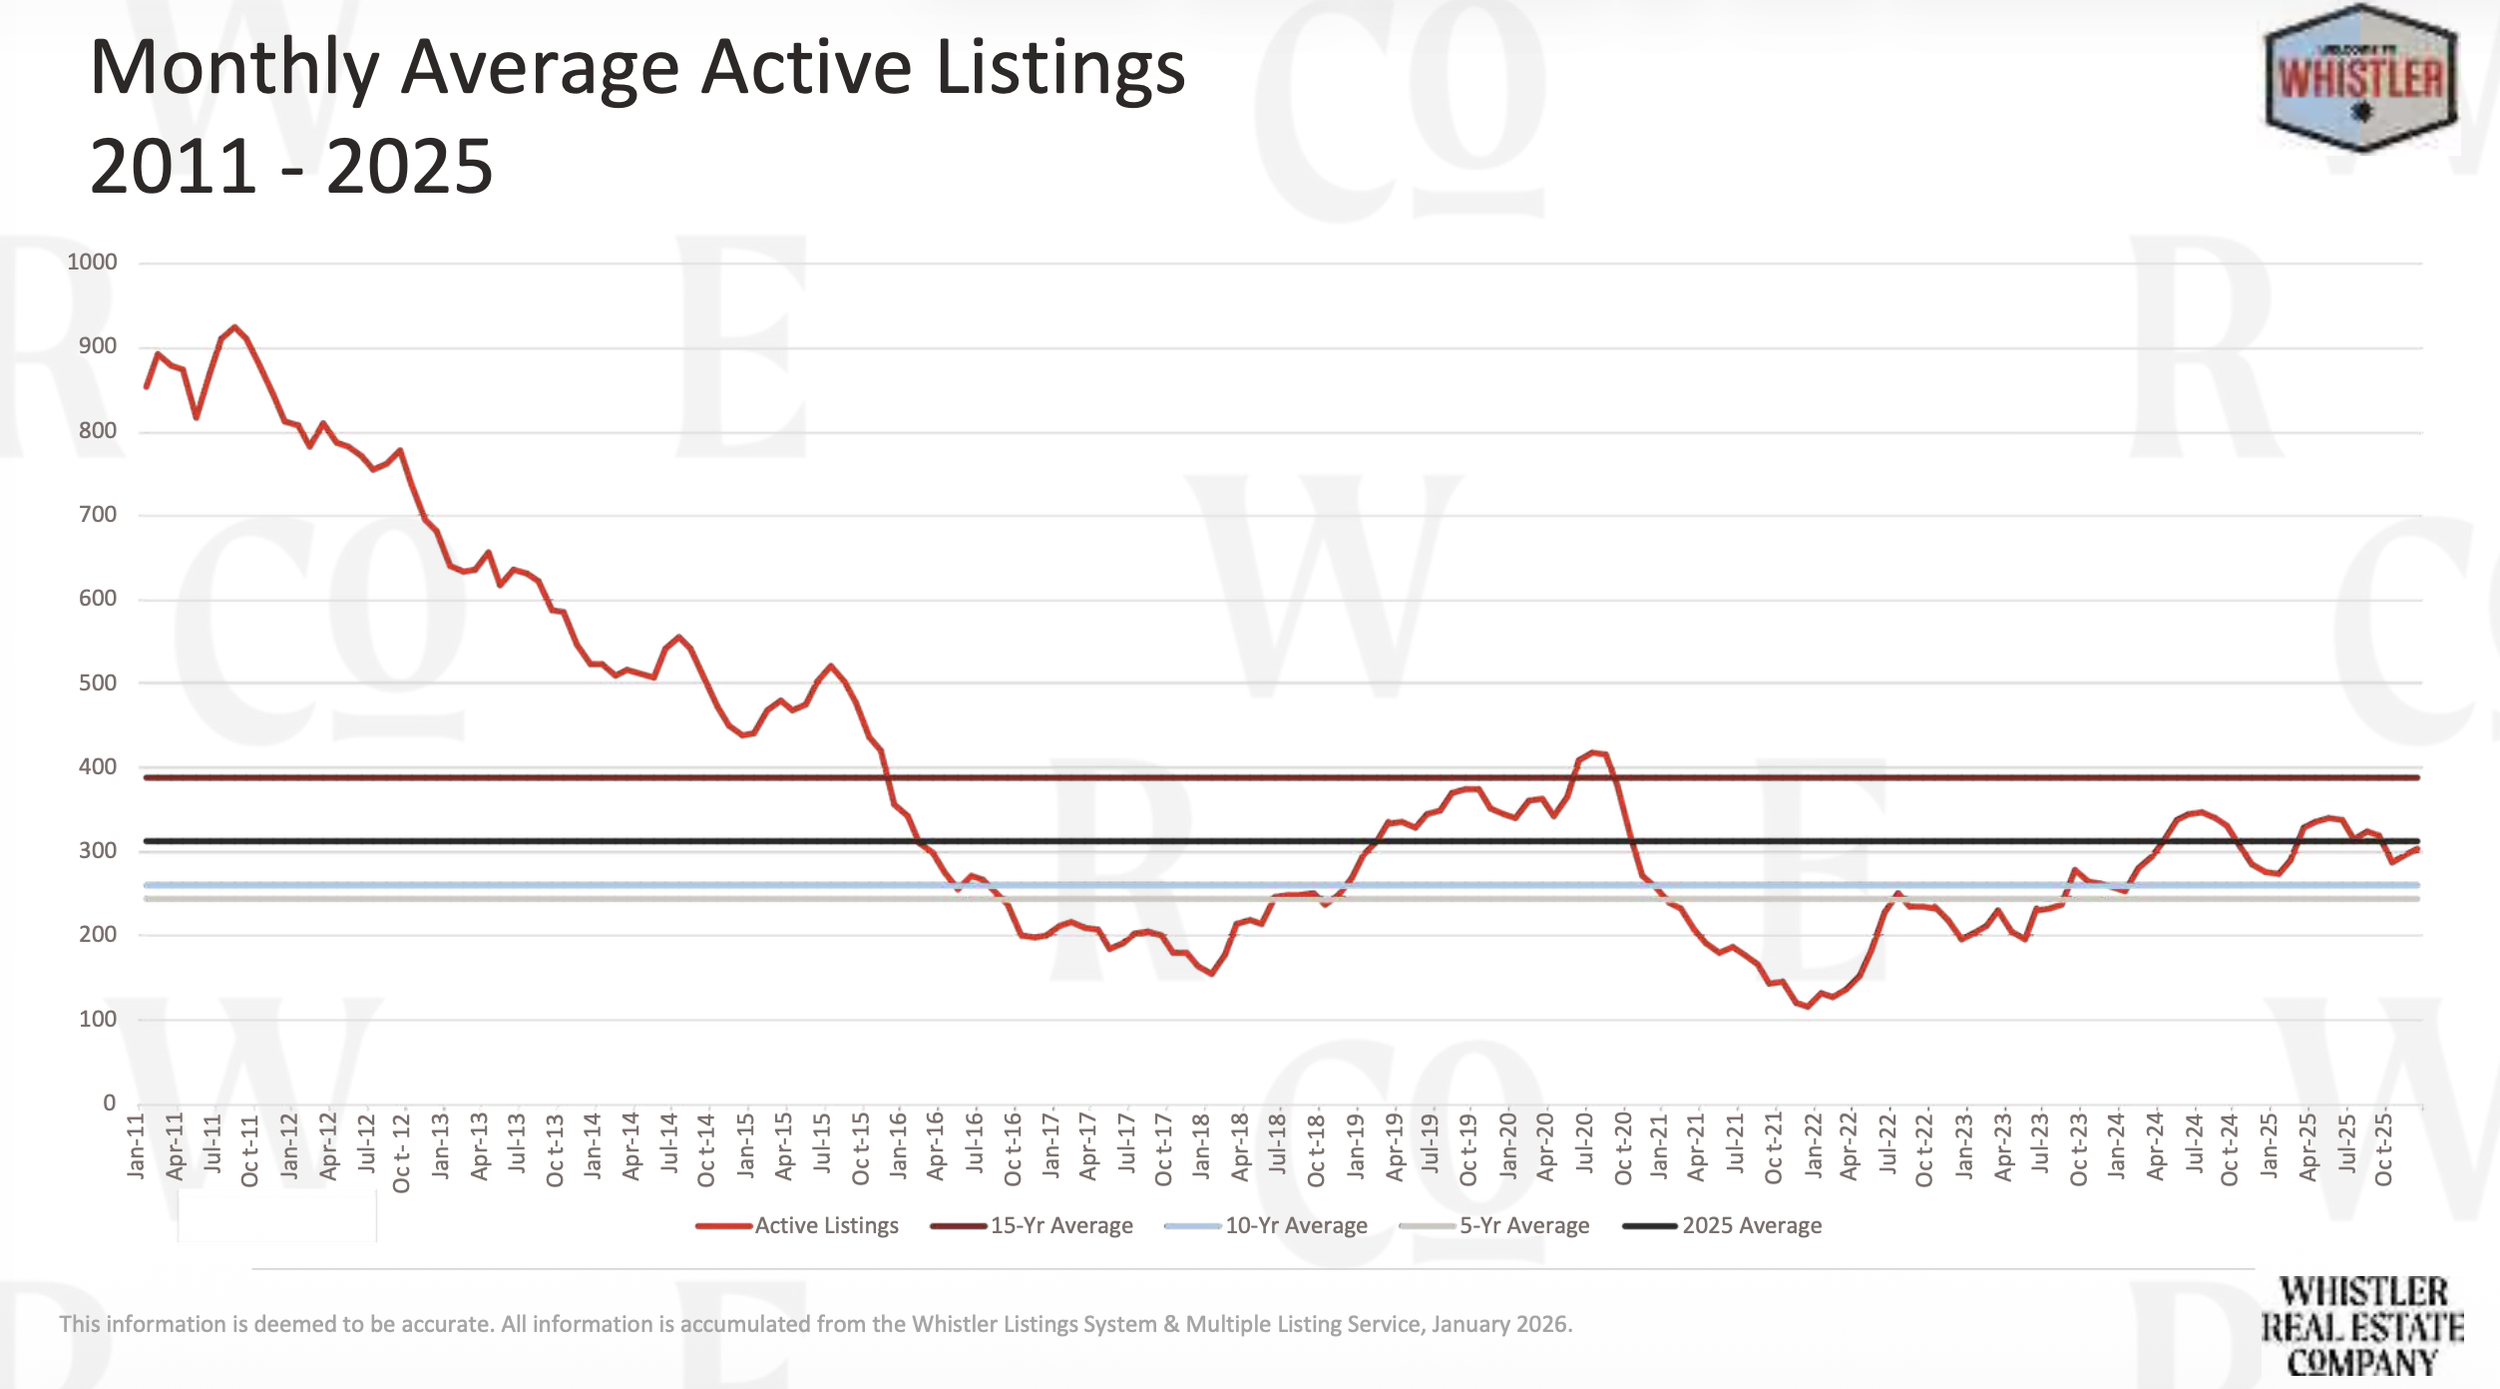
8. Inventory ContexT
The Monthly Average Active Listings chart (page 44) shows a dramatic inventory spike in 2022–2023 followed by normalization.
Less urgency than 2021.
More negotiation than 2021.
But, far more balanced than the oversupply fears suggested.
Balanced markets favour strategy — not panic.
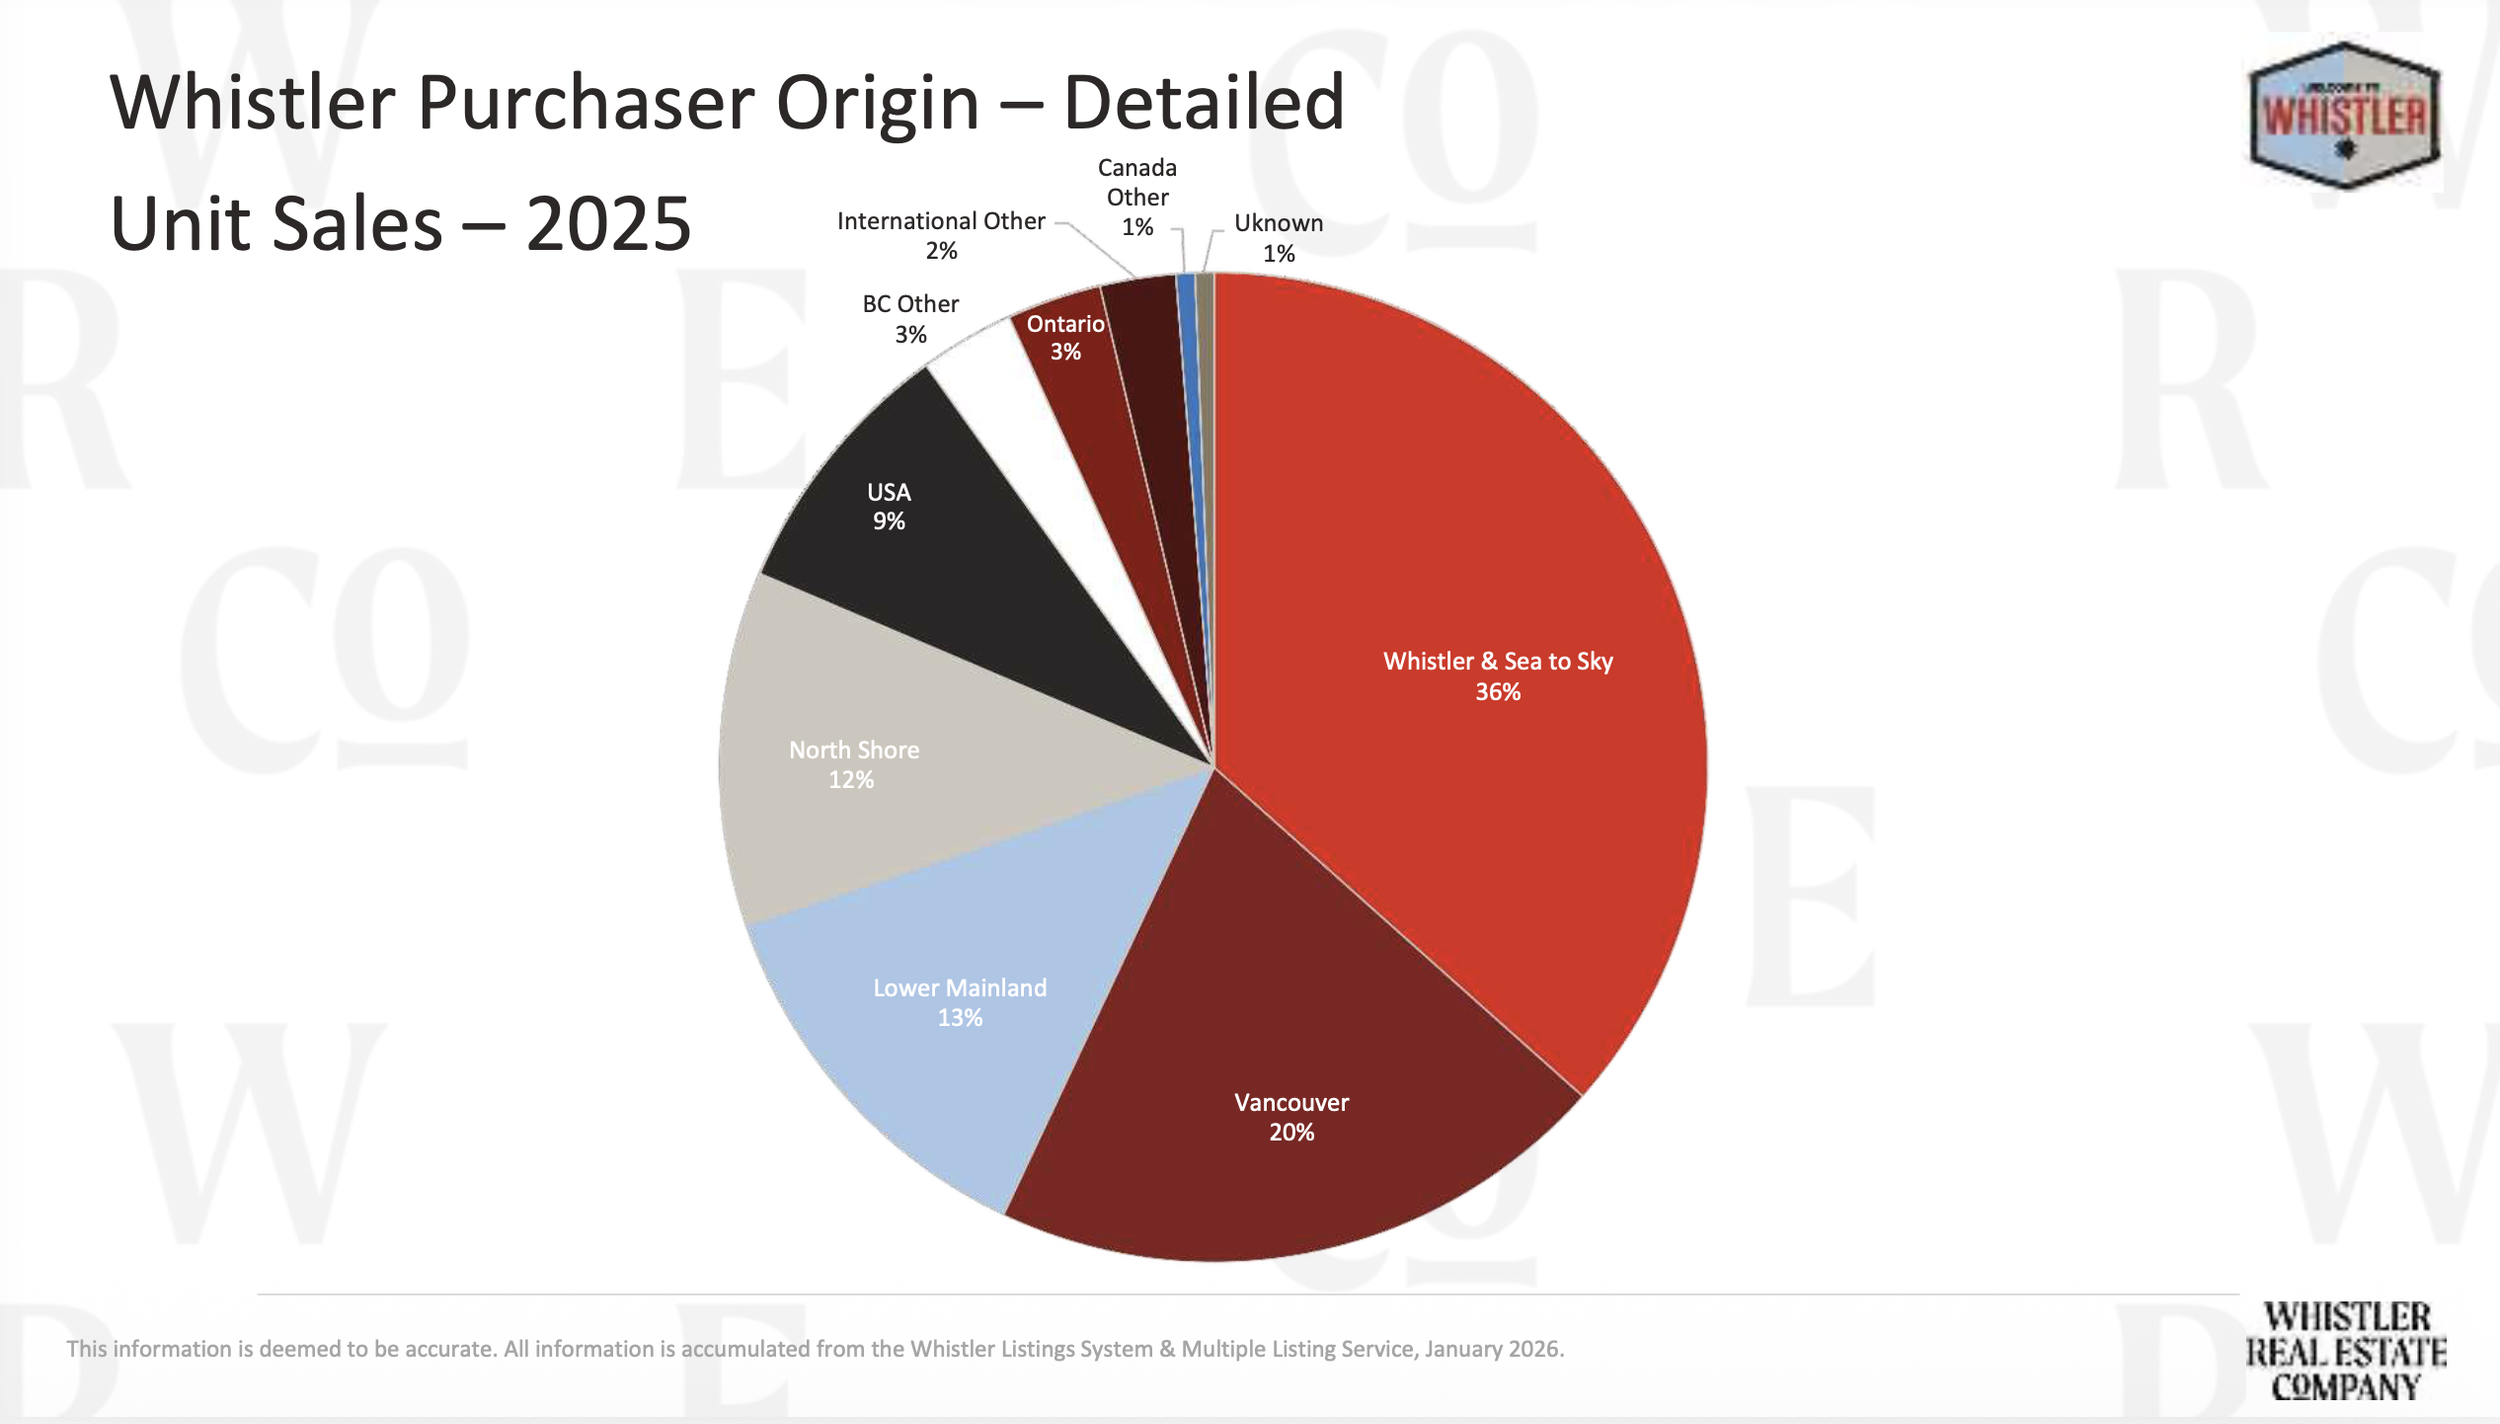
9. who is buying and where from?
Purchaser origin in 2025 (page 45):
• 36% Whistler & Sea to Sky
• 20% Vancouver
• 13% USA
• Remaining, international
Whistler remains primarily a Canadian, lifestyle-driven ownership market.
What This Means for Buyers:
• You have negotiating leverage — if you are informed.
• Pricing must be tied to 5-year medians, not 2021/22highs.
• Zoning and use restrictions matter more than ever.
• Income assumptions must be conservative.
What This Means for Sellers
• Pricing correctly from day one is critical.
• Buyers are referencing 5-year medians.
• Overpricing extends days on market and weakens leverage.
• Well-positioned properties are still transacting efficiently.
Final Perspective
Across nearly every major property type, 2025 unit sales landed almost exactly on their respective 5-year medians.
That’s not weakness.
That’s stability.
The market is shifting and balancing.
And in shifting markets, expertise matters.
If you’d like an interpretation of these numbers, specifically to your home, or buying goals, reach out directly.
We’d be happy to help!
Ray & Julia
teamlm@wrec.com
Team Longmuir Murray